More dashboards, more telemetry and more alerts have not made production incidents easy to diagnose. The problem runs deeper than monitoring.
A familiar production scenario: a customer completes a payment. The money leaves their account. The order is never confirmed.
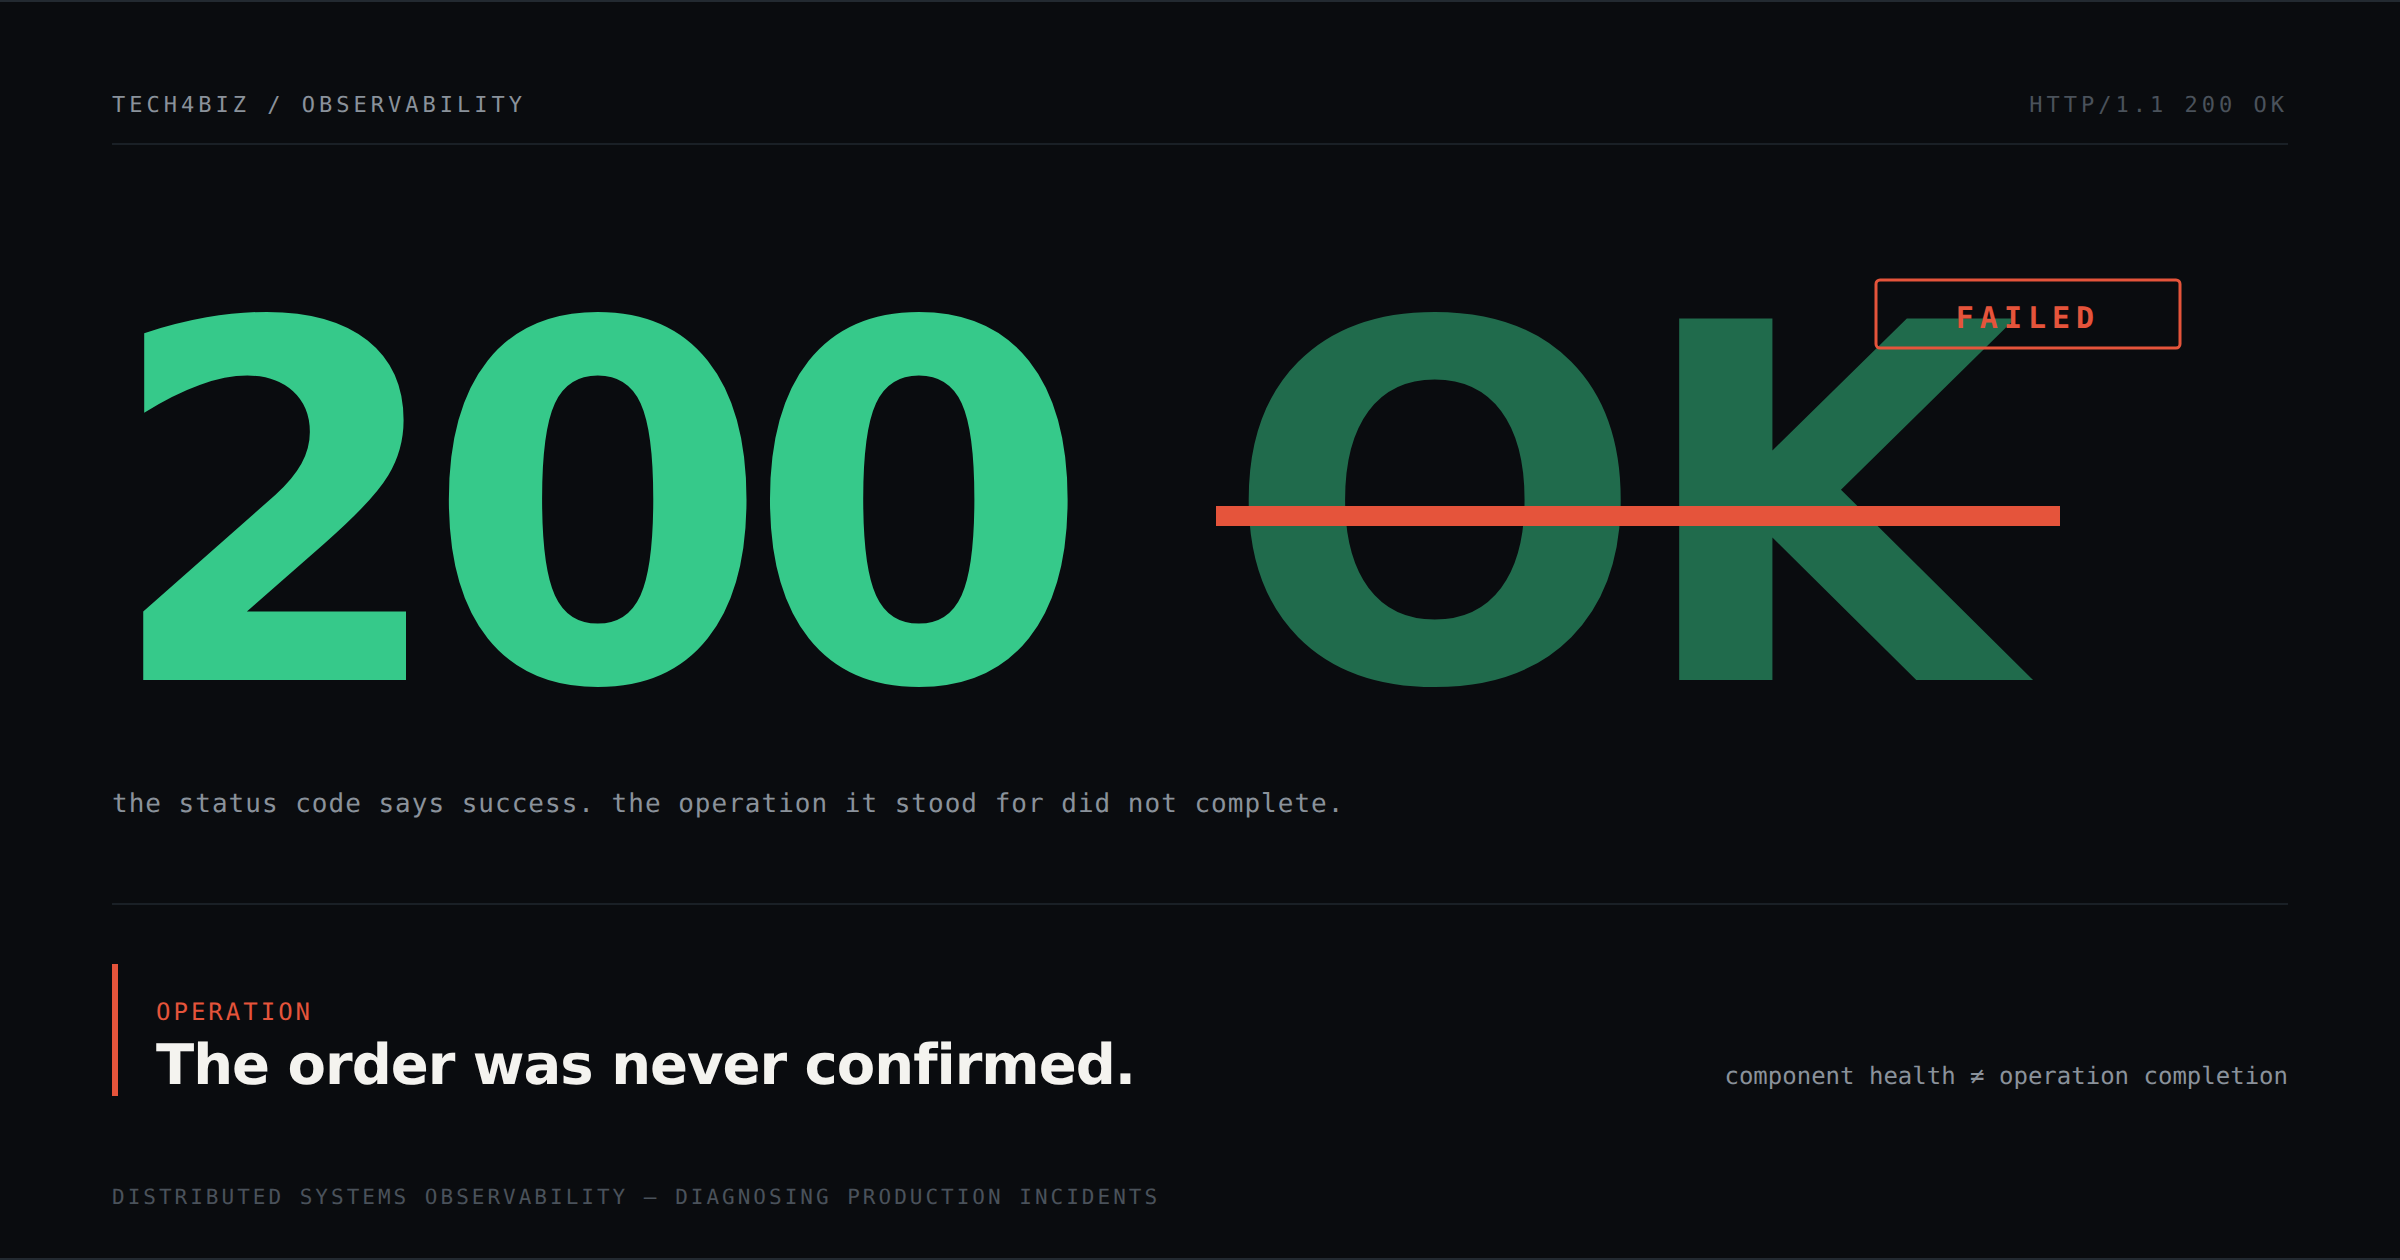
The payment gateway reports success. The API returns a 200. The message broker is available. The order-processing service is running. Every dashboard the operations team checks is green.
But the customer has no confirmation, support has no answer, and nobody can yet say where the transaction stopped. So the incident call begins.
One engineer checks the payment gateway. Another opens the application logs. A third pulls up the queue. A fourth brings up the infrastructure dashboard. Screenshots start landing in the incident channel, timestamps get compared, request IDs get searched by hand. Forty minutes in, someone finds it: the message was accepted by the broker and then failed downstream, and it was sitting in a dead-letter queue where nobody was looking, because the monitoring watched broker availability and consumer health, not whether the order had actually completed.
Every system had reported exactly what it knew. Nobody had held the whole picture.
This is the uncomfortable part of running distributed systems in 2026. You can have monitoring on every major component and still spend the first half of an incident just working out what happened.
The dashboard isn't lying. It's answering a smaller question.
Most monitoring is built to tell you whether something is healthy. Is the host reachable, is CPU within limits, is the API responding, is the database accepting connections, is the broker up. Those are necessary questions, and they are only part of what a team needs during an incident.
A service can return a 200 while the operation it was supposed to complete never finished. A broker can be available while a consumer repeatedly fails to process the messages it receives, and those failures go unnoticed if the processing errors and the dead-letter queue are not themselves being watched. A database can accept connections while queries run slow enough to push the calling service past its response-time budget.
Part of why this happens is that the words each layer uses do not mean the same thing. "Delivered," to a broker, usually means the message was handed to a consumer and acknowledged, not that the work it represented succeeded. Under at-least-once delivery, the common default, a consumer that acknowledges on receipt rather than on completion tells the broker the message is handled the moment it arrives; if the processing then fails, the broker's books already show success. Flip to acknowledging only after the work commits and you trade that silent loss for duplicates on redelivery, which is why idempotent handling has to come along for the ride. None of these are misconfigurations. They are the ordinary semantics of asynchronous systems, and each one opens a gap between what the transport believes happened and what the business actually got.
That gap widens as systems spread across microservices, cloud infrastructure, external APIs, brokers and third-party platforms. A business operation rarely lives inside one service any more. A payment, an insurance claim, a patient registration or a supplier transaction can pass through several systems before it is done. Monitoring each component tells you how the components are behaving. It does not, on its own, tell you whether the operation itself succeeded, and that is a different level of visibility from the one most stacks were built to give.
Averages make this worse by hiding it. A dependency can show a perfectly healthy mean response time while its 99th percentile quietly blows past the budget, and in a system where one operation fans out to several services, the slowest of them sets the pace: the operation is only as fast as its worst tail, so a problem that touches one request in a hundred at each hop becomes a problem that touches most complete operations. A dashboard reporting the average stays green the entire time. The percentile that actually governs the customer's experience is the one nobody is being paged on.
The failure often sits in the space between two healthy systems
Take an ordinary asynchronous flow. An order service receives a request, creates the order, and publishes an event. A broker accepts it. A consumer picks it up, processes it, and updates the record.
There are several ways that goes wrong without anything going "down." The consumer rejects a message because the payload no longer matches the schema it expects. A downstream dependency times out. A retry policy exhausts its attempts and the message lands in a dead-letter queue. Depending on how acknowledgement is configured, a consumer can acknowledge a message before the work it represents has actually completed, so the broker considers it handled while the business operation did not finish. None of those means the broker is unavailable or the consumer process has crashed. The monitoring stays green while unfinished work quietly piles up.
There is a second problem on top of that. Even when the logs and traces exist, they are often not connected. The request starts with a trace ID. The service publishes an event. That event crosses a broker and reaches a consumer. Unless the trace context, or an equivalent correlation key, is carried across that boundary, the producer side and the consumer side show up as two separate investigations, and an engineer ends up stitching the sequence back together from timestamps, message IDs and logs in different systems.
The mechanics of why are worth being precise about, because they explain why so many traces quietly break at exactly this point. Inside a synchronous call chain, context travels in band: the trace and span identifiers ride along as request headers, and each hop reads them and carries on the same trace. An asynchronous hop has no such shared request. The producer has to inject the trace context into the message's own metadata as it publishes, and the consumer has to extract it when it picks the message up, often much later, on a different host. If either side skips that step, or the broker or client library does not support carrying the fields, the parent-child link between the producing span and the consuming span is simply never formed. The two halves still emit perfectly good traces. They just belong to two different trace trees, and no amount of searching reconstructs the link the system never recorded.
The industry knows this well enough to have standardised against it. OpenTelemetry's messaging conventions describe exactly how the message-creation context has to be propagated through intermediaries, and the span-link concept exists precisely to tie a consumer's work back to the publish that caused it. Asynchronous messaging is ordinary architecture now, which means cross-boundary correlation is something you design and maintain on purpose, not something you get for free.
More telemetry has brought its own burden
The industry has spent years getting better at collecting this data. Metrics, logs and distributed traces are standard, and OpenTelemetry has made it far easier to gather and export them across different environments. Collecting the data and making it useful mid-incident, though, are two different problems, and the 2026 numbers show the gap plainly.
New Relic's 2026 Observability Forecast for India, which isolated 500 India-based respondents from a global survey of 2,575, found organisations moving fast on adoption, with 42% reporting full standardisation on OpenTelemetry as their primary collection approach and the average organisation running six observability tools, up from five the year before. Only 20% said AI-assisted observability had significantly improved their event correlation. Standardising how telemetry is collected, in other words, has not by itself solved how it gets brought together when something breaks.
The global picture matches. Grafana Labs' 2026 Observability Survey, of 1,363 practitioners and leaders, found 38% naming complexity and overhead as their biggest concern, 34% citing signal-to-noise, and alert fatigue the most common obstacle to faster incident response at 30%. There has been real progress alongside that: 77% of the same respondents said centralised observability had saved them time or money. So centralisation is helping. The part still left open is making sure the information being centralised is connected in a way that actually supports diagnosis. An alert that a queue is filling up is useful. An alert that also names the stuck consumer, the messages failing to process, the age of the backlog and the operations waiting on them is a different thing, and the difference is context.
There is also a real cost to the instinct that the answer is simply more telemetry. The expensive dimension is not volume, it is cardinality: the number of distinct label combinations a metric can take. Attach a few unbounded labels, a user ID, a request ID, a full URL, and a single metric can explode into millions of unique time series, each one stored and indexed separately. Storage and query cost climb with it, and so does the noise an engineer has to wade through mid-incident. More raw signal, past a point, buys less clarity, not more, which is why the teams that cope well are selective about what they measure with high cardinality and deliberate about what they correlate, rather than capturing everything and hoping the answer is somewhere in the pile.
Finding the alert is not the same as finding the failure
When an incident starts, engineers need answers to a fairly specific set of questions, and they need them quickly: which operation was affected and where it stopped, which dependency was involved, whether the request failed or timed out or came back with the wrong result, whether retries were attempted, whether it hit one customer or thousands, and whether a deployment or config change landed shortly before it began.
A pile of disconnected alerts rarely answers those. The first signal might be an API latency threshold, the second a growing backlog, the third an external service's own status page. The engineer's real job in that moment is to work out whether those three signals even describe the same incident, how they relate, and which event actually caused the failure.
That is where observability has to be more than metrics, logs and traces gathered side by side. It needs enough shared context to follow one operation across service boundaries, to see the dependencies, delays, retries and failed events along the way, and to tell a component that is down apart from one that is up and answering while quietly failing to finish its work. It also has to connect the symptom to what the business cares about: a five-minute delay in a background reporting job may be fine, while the same five minutes on a customer payment is not. Without that context, teams spend the first stretch of every incident deciding which signals matter before they can start on the failure itself.
The lesson from a high-traffic streaming platform
We met this problem on a consumer live-streaming platform built to absorb concentrated spikes in traffic, the kind where a surge of viewers arrives in the same few minutes and every billing, authentication and delivery path lights up at once. A single viewer request passed through several independently managed systems before anything played, from authentication and subscription validation through content delivery to playback. Each of those systems had its own monitoring. What the engineering team did not have, when viewers hit delayed playback, was a unified way to see where in that journey the delay was actually coming from.
Adding another dashboard was not going to fix that. What was missing was not more monitoring; it was a way to follow one request across the systems it touched.
So the first thing we delivered was not a dashboard. It was a correlation layer, a way to follow an individual request across the whole viewing journey rather than investigating each component on its own. What had meant pulling logs from several systems and reconstructing a timeline by hand became a connected view of the request, where the team could see where time was being spent and tell a problem in authentication apart from one in entitlement validation, content delivery or playback. The hardest part of that work lives exactly where you would expect, at the boundaries between independently operated systems, which is precisely where the context needed to connect them tends to get dropped.
That experience shaped a principle we keep applying. Establish reliable correlation first, so one operation can be followed wherever it goes, and build the statistical baselines, the pattern detection and, eventually, the agents that act, on top of that foundation. Skip the base and every layer above inherits the same blind spot, because a model cannot reason about a relationship the data never captured. The lesson was never that the platform needed more monitoring. It needed a way to understand how its existing systems behaved together.
What production observability should actually give you
The goal is not to pile every metric onto one enormous dashboard; that only moves the complexity somewhere else. For a distributed transaction, a useful operational view lets an engineer follow the operation from its first request through the services, queues and external dependencies it touches, see where it slowed, where it failed, whether a retry succeeded, and whether the business outcome was actually reached, without hand-assembling the story from unrelated screens.
This is not a promise that every failure can be predicted or that root cause can be fully automated. Distributed systems are too varied for that to be honest. It is a lower and more useful bar: the engineering team should not have to open every incident by asking five people to open five tools and compare what they see. The instrumentation, the context and the relationships that investigation needs should already be in place before the incident arrives.
This is the problem we're working on with Vigil
Our work on enterprise platforms and high-scale observability kept returning us to the same gap, the distance between collecting operational signals and understanding what is actually happening across a production environment. Vigil is how we're closing it, and we're building it as a system that grows with the maturity of the team using it.
It starts where the real leverage is, and where our own delivered work sits today: correlating signals across systems so a single operation can be followed wherever it goes, and the question shifts from "is this component healthy" to "did this piece of work complete, where did it get stuck, and what else is affected." On that foundation the later layers become possible and honest, and we're clear about which is which. Statistical baselines that mean something because they sit on correlated data are the near-term build. Pattern detection on top of that, and agents that can take operational action where it genuinely helps, are the direction we're building toward, not features we'd claim as shipped today. The order is the point: the base has to come first, and everything above it is only as trustworthy as the correlation underneath.
We think the value of observability should be measured by how much faster a team can understand and resolve a real production problem, not by how many dashboards it can keep alive.
Green dashboards are not proof of a healthy business
A system can be available while the operations that matter most are failing. An alert can be accurate and still leave an engineer without the context to act. A team can collect an enormous amount of telemetry and still spend an hour reconstructing a transaction that should have been traceable from the first request.
So the question to put to your monitoring is not only whether it tells you when something goes down. It is whether it can show you what happened when everything appeared to be up. Because when the next incident arrives, your engineers should not be reconstructing production reality from five dashboards, three log stores and a crowded incident channel. They should already have the context to see what broke, where, and what it touched.
Every distributed environment has its own blind spots, and the first useful step is understanding where visibility breaks down across your own systems and what it would take to connect the picture. That is the conversation our engineers would rather have with you, working from your actual infrastructure, than any generic demo.
Tech4Biz builds AI, software, cloud and hardware for high-stakes systems, from the silicon up, so the decisions that matter are provable, not just probable. If your engineers are still reconstructing incidents across disconnected tools, talk to our engineers.
References: New Relic 2026 Observability Forecast, India edition edition, newrelic.com. Grafana Labs 2026 Observability Survey, grafana.com. OpenTelemetry Semantic Conventions for Messaging, opentelemetry.io.
Every distributed environment has its own blind spots
The first useful step is understanding where visibility breaks down across your own systems, and what it would take to connect the picture. Our engineers work through that from your actual infrastructure, not a generic demo.
References: New Relic 2026 Observability Forecast, India edition · Grafana Labs 2026 Observability Survey · OpenTelemetry Semantic Conventions for Messaging